Hi all,
I’m looking for help with a recommendation/list on how to identify (possible) causes for memory leakage?
My webapp has a bad case of memory leakage. These are the results - every try is after a fresh login (base memory usage is 0.2 GB):
- Switching 17 times between the main page and the same project → memory increase 0.7 GB.
- Switching 17 times between the main page and different individual projects → increase 1.7 GB
- Creating 17 projects and recording 1 value → increase 3.5 GB. Each cycle, a couple data collections are (re)fetched with a combined size of approx. 500kB, so doing that 17 times would be <10MB.
- Deleting 17 projects → increase 0.2 GB
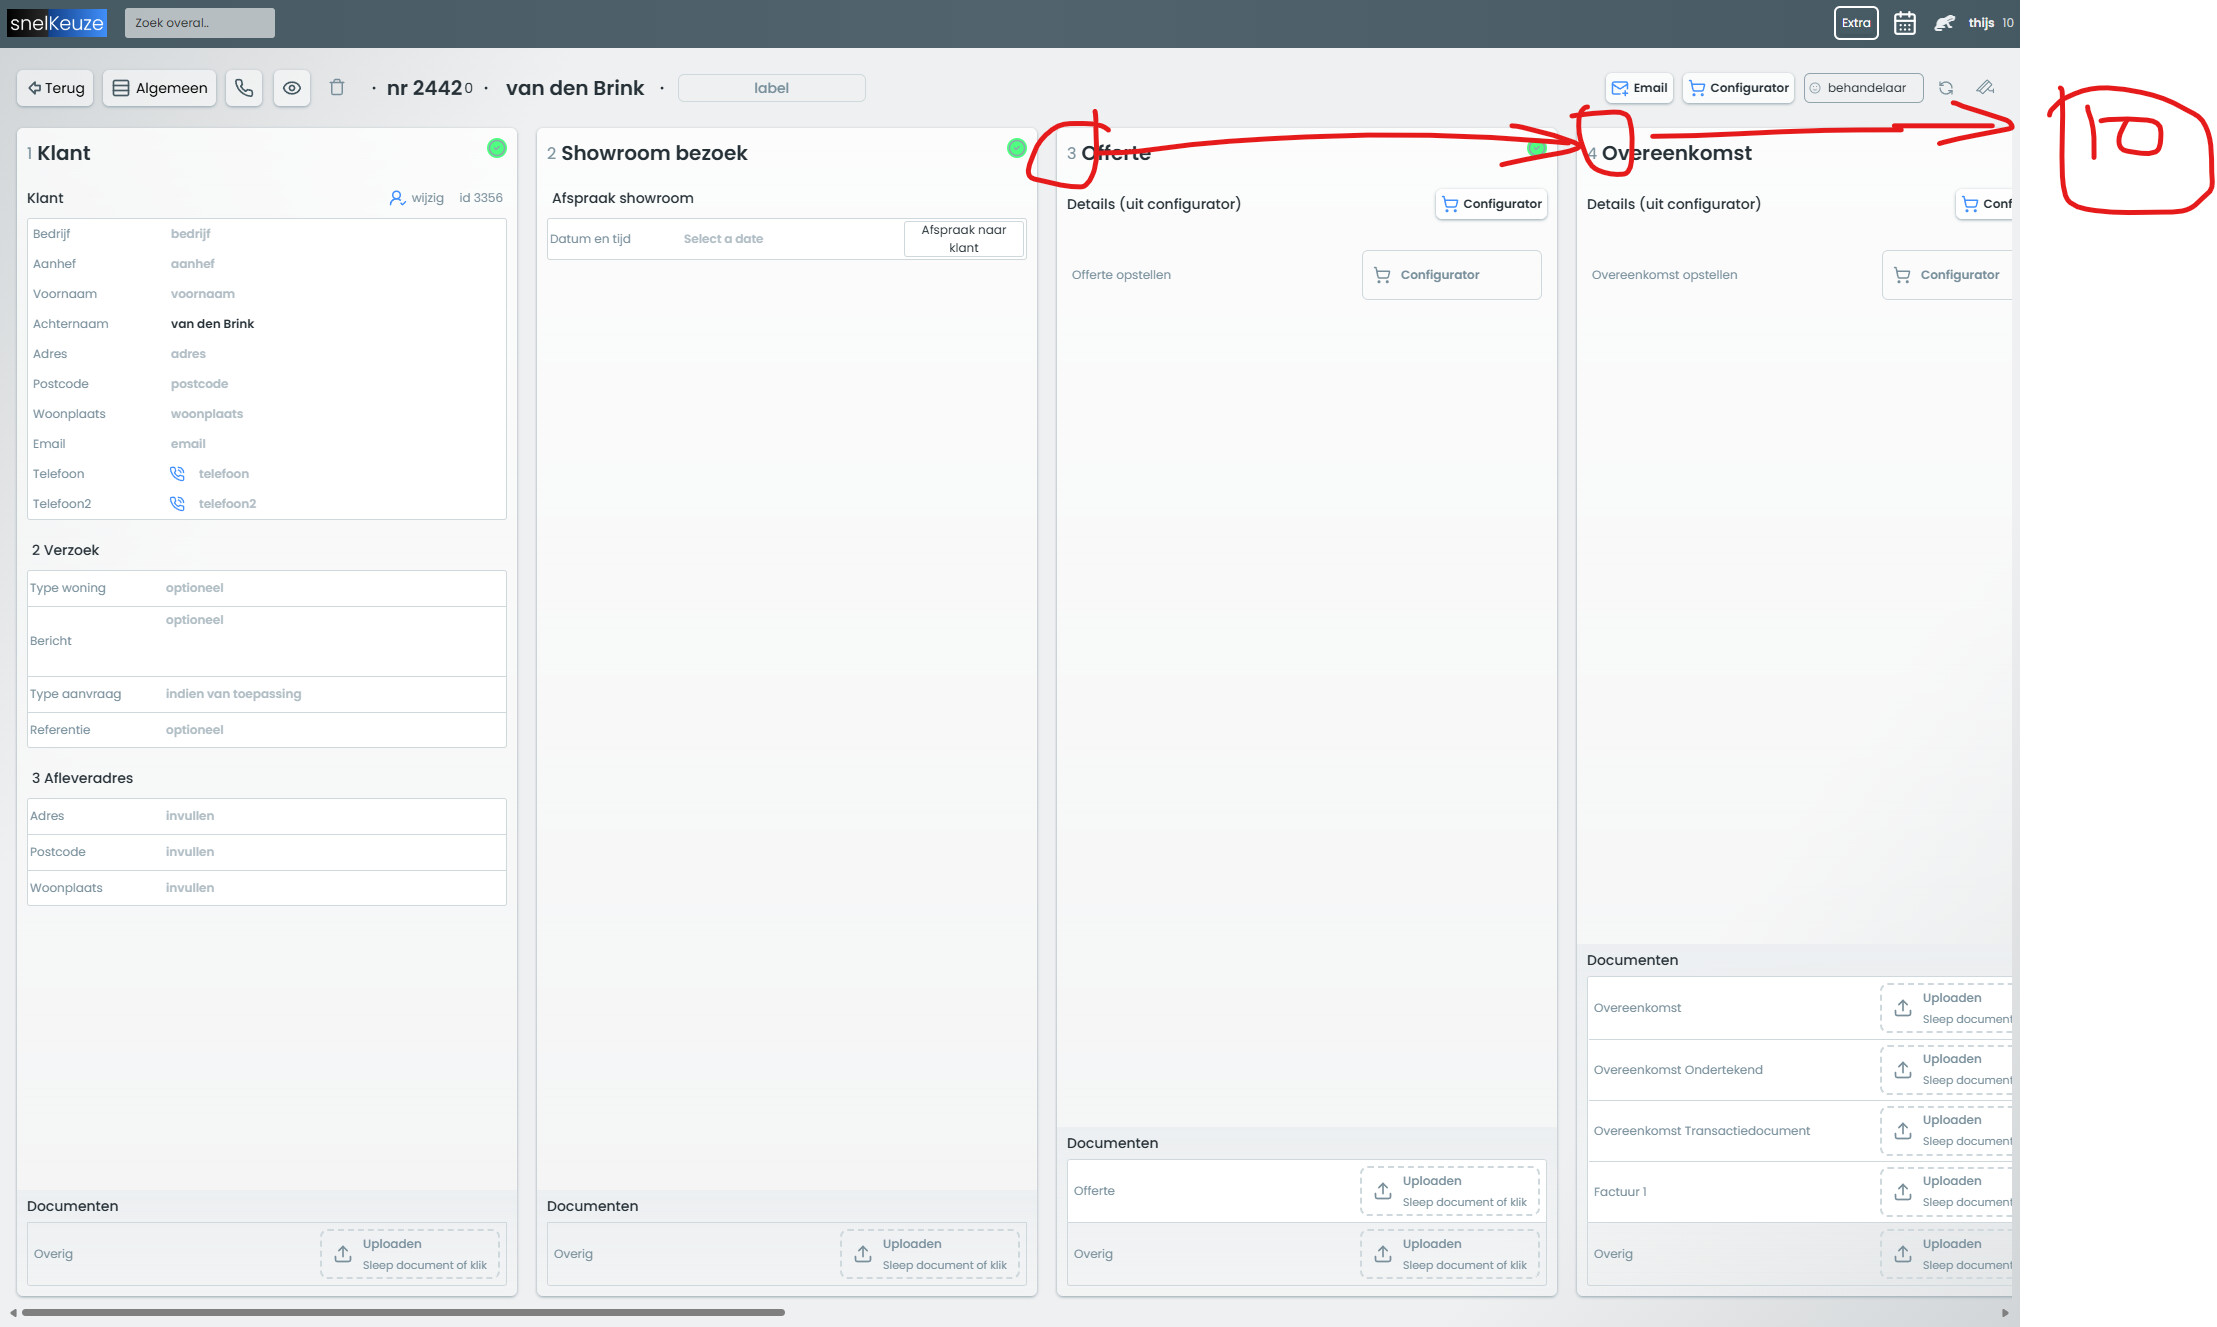
Technically the two pages are nothing spectacular, as they both have their own simple data collection (with few items) and straightforward logics. The project details page has about 50 input fields (divided over 10 steps) which are all visible - could that have something to do with it? See screen prints to get an impression.
Similar topics in the community gives me the impression that it’s a known weakness but with an unknown cause. I hope that’s not true. And as Weweb doens’t seem to have any guidance on how to prevent this, I hope it’s like an incident that can be fixed.